
by CCFT Negotiations Team
Background
 Current District/CCFT Contract language (13.1) states, “The intent is that CCFT receive a fair share of increased revenues to be allocated toward the faculty total compensation package of salary and benefits, with the goal of returning to and improving the salary schedules as quickly as possible.” The Contract language explicates that, “the following will be considered in determining the availability of new revenue for total compensation and to inform a “fair share” approach: state revenues, the Cabrillo base budget, CCFS-311 reports; the faculty obligation number (FON); allocation of teaching units; the 50% law; workload; and total faculty expenses, including salary, health and welfare benefits and professional growth & development for the current year and in the future, with a goal of increasing the percentage of the college budget spent on faculty salaries as a percentage of the budget.”
Budget Surplus
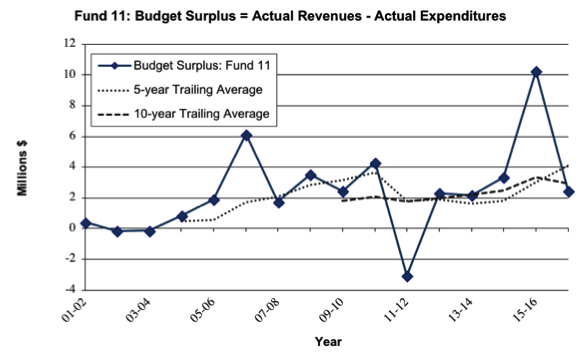 Let us first examine the historical base budget surplus (Fund 11) which is simply the actual revenues minus the actual expenditures. Simply stated, the budget surplus is money that the college could have spent without actually seeing a deficit. You will notice that the 2016-17 budget surplus was 2.45 million dollars. You can also see the 5-year trailing average[1] is over 4 million dollars while the 10-year trailing average is about 3 million dollars. One way of thinking about the trailing averages it to realize that the complexities inherent in our financial situation no longer allow our budgets to accurately reflect the actual revenues and expenditures of the college.
Note: The drop in 2011-12 was due massive mid-year budget reductions at a time when state revenues fell significantly below projections.
Net Ending Balance
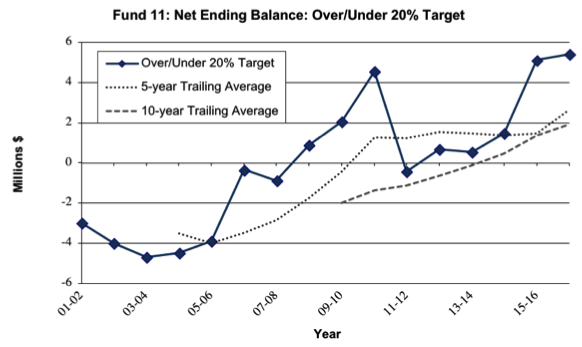 Examining the net ending balance (NEB) can also provide insights into our financial health. For the last 10 years or so, the target net ending balance has been 20%. While some may debate the appropriateness of this target, we will not do so here. Rather, let’s look at historical trends in relation to the actual NEB in relation to the 20% target. You will notice that the actual NEB for 2016-17 was 5.42 million dollars over target. You will also see that both the 5 and 10-year trailing averages are over target by 2.64 and 1.94 million respectively.
Total Reserves
The total reserves of the college have increased over the last 10 years. The official target was increased from 5 to 7% in 2014-15. For 2016-17, the reserves amounted to 4.47 million dollars. The reserves provide a sense of financial security to handle unexpected situations.
Unallocated One-time Operating Reserves
At the April 18th meeting of the College Planning Council (CPC), the district shared updates to the budget planning parameters [Attachment C, Attachment D], and estimates of the year end fund balances [Slides]. This included the NEB which is estimated to be about 18 million (about 4.8 million above the 20% target) and the unallocated one-time operating reserves projected to be about 7.8 million at the beginning of FY 2018-19. The district also provided projections for the unallocated one-time operating reserves extending through the end of FY 2019-20. In these two years, the district expects to spend:
- 0 million on technology
- 0 million on facilities
- 3 in matching funds for facilities projects
- 1 million on program plans
The projections moving forward are highly dependent on the end-of-year actuals and how the final state budget affects Cabrillo’s budget.
[1] Trailing averages are calculated by summing the actual values over a 5 or 10-year period and then dividing by the number of years being averaged. Trailing averages are useful in smoothing irregularities to see long-term trends.